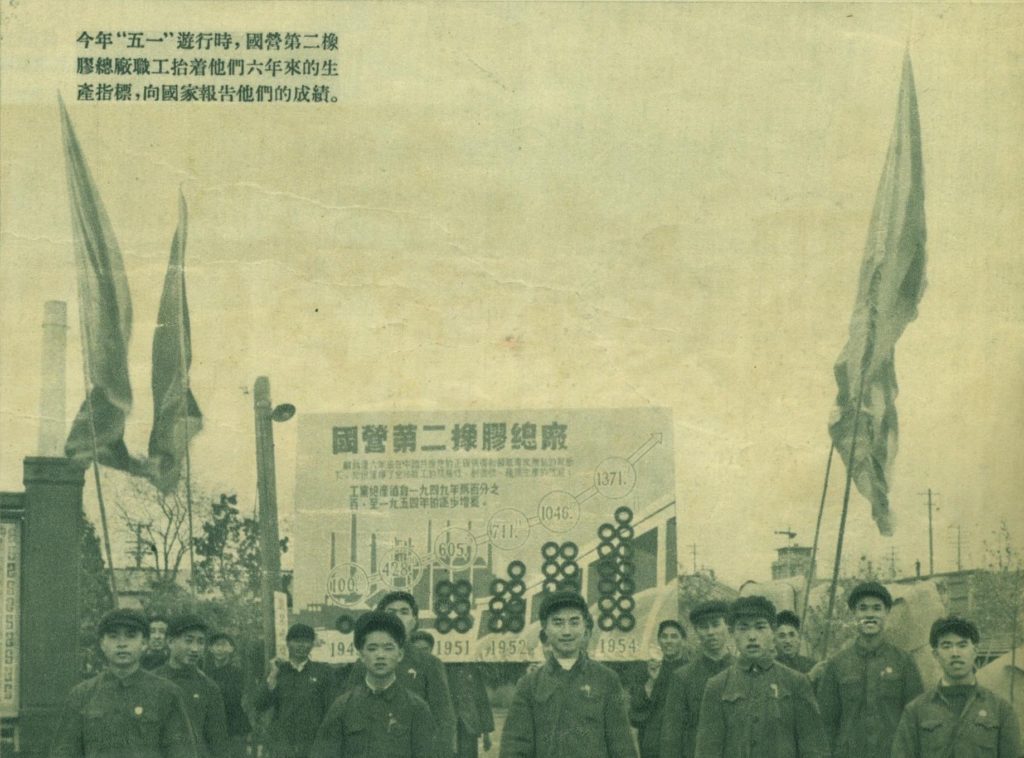
What can be termed a “statistical procession” took place on May 1st 1955, when workers and technicians from the Second National General Tire Plant 國營第二橡膠總廠 in Qingdao displayed their six-year production of rubber tires from 1949 to 1954. What looks like a linear growth in total production actually corresponds to a highly unstable augmentation rate: 328%, 41%, 18%, 47%, 31%. Like any unsmooth statistical data, contextualizing these numbers historically, and not simply doing away with them as “lies” is an important yet challenging task for any historian working quantitatively. A toolbox is in the making.
Visualizing Progress